The first post scanned 95 days of logs and found sub-agent cache TTL silently dropped to 5m. The second tracked it to 17 consecutive days of 100% 5m — conclusion: it’s the new default.
This time I broke down the model dimension. Scanning March through May 7, I originally wanted to confirm whether the cache TTL had reverted (it hasn’t). Instead I found something bigger: the server doesn’t just control cache TTL — it silently switched the main agent model three times.
Data Source
Same as before: ~/.claude/projects/{project-path}/{session-uuid}.jsonl. This time I also checked the message.model field in API responses:
| |
The model field comes from the server, not the client. Whatever the API says it used, that’s what it used.
Only Four Models
Scanning all JSONL files, only four models appeared:
| Model ID | Short | Input | Cache Read | Cache Write 5m | Cache Write 1h | Output |
|---|---|---|---|---|---|---|
| opus-4-6 | O4.6 | $15/MTok | $1.50 | $18.75 | $30 | $75 |
| opus-4-7 | O4.7 | $15/MTok | $1.50 | $18.75 | $30 | $75 |
| sonnet-4-6 | S4.6 | $3/MTok | $0.30 | $3.75 | $6 | $15 |
| haiku-4-5 | H4.5 | $0.80/MTok | $0.08 | $1.00 | $1.60 | $4 |
Cache read costs differ 5x between Opus and Sonnet ($1.50 vs $0.30), output 5x ($75 vs $15). Since cache reads dominate Claude Code API calls, model choice directly determines cost magnitude.
Main Agent Silently Switched Three Times
Using cc-office (my primary project) as an example, the main agent model timeline:
| |
I had opus-4-6 1m context selected the entire time. But the server returned a different model three times:
- 4/15-4/17: Downgraded to sonnet-4-6 (3 days)
- 4/18-4/25: Switched to opus-4-7 (8 days)
- 4/30-5/5: Downgraded to sonnet-4-6 again (6 days)
Each switch was binary — 100% one model the day before, 100% another the next day. Same pattern as the cache TTL regression: sharp switch, no announcement, client unaware.
Sub-Agent Models Are Not Your Choice
Sub-agent models are decided by Claude Code autonomously, not by user settings. The distribution varies dramatically:
| Period | Main | Sub O4.6 | Sub O4.7 | Sub S4.6 | Sub H4.5 |
|---|---|---|---|---|---|
| 3/26-4/14 | O4.6 | 76% | — | 4% | 19% |
| 4/15-4/17 | S4.6 | 0% | — | 7% | 92% |
| 4/18-4/25 | O4.7 | — | 27% | 1% | 73% |
| 4/26-4/30 | O4.6 | 34% | — | 28% | 37% |
| 5/01-5/05 | S4.6 | — | — | 64% | 36% |
| 5/06-5/07 | O4.6 | 47% | — | 30% | 23% |
When main uses Opus, sub-agents tend to also use Opus (76%). When main is downgraded to Sonnet, sub-agents switch to mostly Haiku (92%). This correlation isn’t coincidental — the server adjusts sub-agent model allocation alongside main model changes.
How to Measure Efficiency
The previous posts focused on cache TTL. This time: how much did you spend for how much main agent output.
Why main output:
- Main agent output is what you’re paying for — code, edits, answers
- Sub-agents are overhead — their job is to search and gather for the main agent
- Sub-agent output feeds into main agent input, not into your deliverables
Core metric:
Total cost (main + sub) per million main output tokens
Lower = more efficient.
Efficiency Rankings Across Seven Periods
Segmented by dominant main agent model:
| Rank | Period | Main | S/M ratio | $/M main output | $/day |
|---|---|---|---|---|---|
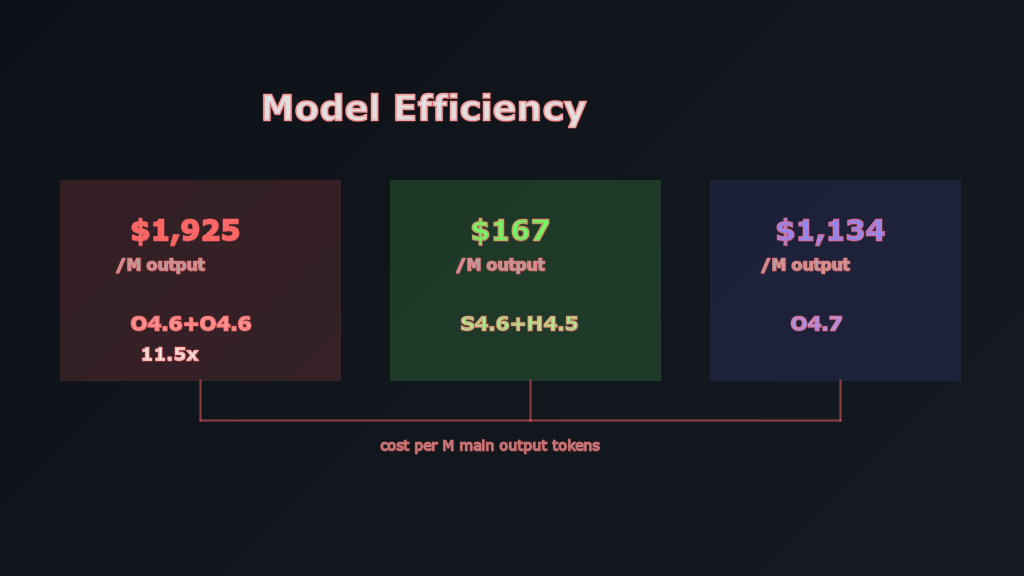
| 1 ⚡ | 5/01-5/05 | S4.6 | 0.91 | $167 | $319 |
| 2 | 4/15-4/17 | S4.6 | 0.30 | $218 | $583 |
| 3 | 3/09-3/21 | S4.6 | 2.04 | $875 | $144 |
| 4 | 4/26-4/30 | O4.6 | 0.47 | $896 | $1,450 |
| 5 | 4/18-4/25 | O4.7 | 0.23 | $1,134 | $3,148 |
| 6 | 5/06-5/07 | O4.6 | 0.35 | $1,554 | $2,836 |
| 7 🐌 | 3/26-4/14 | O4.6 | 0.55 | $1,925 | $2,137 |
11.5x gap between the most and least efficient periods.
Most Efficient: Main S4.6 + Sub S4.6/H4.5 (5/01-5/05)
| |
S/M ratio of 0.91 looks high — nearly one sub call per main call. But subs only use Sonnet and Haiku, so overhead is just $56/M main output. Cheap sub calls don’t hurt even when frequent.
Best bang for buck: 5,991 main output tokens per dollar.
Least Efficient: Main O4.6 + Sub 76% O4.6 (3/26-4/14)
| |
S/M ratio is only 0.55 — looks disciplined. But sub-agents used 76% Opus, meaning every sub call pays Opus-rate cache reads. Sub overhead hits $477/M main output.
Main output per day was only 1.11M — the lowest across all periods. Most money spent, least produced.
Most Expensive but Not Most Efficient: Opus 4.7 (4/18-4/25)
| |
Highest daily output (2.77M tokens), lowest S/M ratio (0.23), sub overhead only $15/M. Looks lean, but $3,148/day is steep — the Sonnet period (4/15-4/17) produced 2.67M/day for just $583.
Sub-Agent Overhead Rankings
Sub cost divided by main output — pure overhead measurement:
| Rank | Period | S/M ratio | Sub Composition | Sub $/M main output |
|---|---|---|---|---|
| 1 ✅ | 4/15-4/17 | 0.30 | H4.5 92% | $6 |
| 2 | 4/18-4/25 | 0.23 | H4.5 73%, O4.7 27% | $15 |
| 3 | 5/01-5/05 | 0.91 | S4.6 64%, H4.5 36% | $56 |
| 6 | 3/26-4/14 | 0.55 | O4.6 76% | $477 |
| 7 ❌ | 3/09-3/21 | 2.04 | O4.6 20%, S4.6 71% | $695 |
Two patterns:
- Sub-agents should use Haiku. Period 4/15-4/17 with 92% Haiku had $6/M overhead — 1/80th of using Opus
- High S/M ratio isn’t inherently bad. Period 5/01-5/05 had 0.91 ratio but cheap models, so overhead was only $56. Period 3/26-4/14 had 0.55 ratio but 76% Opus, pushing overhead to $477
S/M ratio isn’t the problem. What model the sub uses is the problem.
Side-by-Side Comparison
| Metric | Best S4.6 (5/01-5/05) | O4.6 (3/26-4/14) | O4.7 (4/18-4/25) |
|---|---|---|---|
| Daily cost | $319 | $2,137 | $3,148 |
| Daily main output | 1,911,894 | 1,110,123 | 2,777,484 |
| $/M main output | $167 | $1,925 | $1,134 |
| Tokens per dollar | 5,991 | 520 | 882 |
| Sub overhead/M | $56 | $477 | $15 |
| Sub primary model | S4.6+H4.5 | O4.6 76% | H4.5 73% |
What You Can’t Control
All analysis in this post comes with a caveat: model choice isn’t fully in your hands.
What you control:
- Selecting a model in Claude Code settings (I selected opus-4-6 1m)
What you don’t control:
- Server may silently swap your main agent model
- Sub-agent models are assigned by Claude Code autonomously
- Cache TTL is server-decided (sub-agent stuck at 100% 5m for 29 consecutive days)
The “Using Opus 4.6” label in Claude Code may not reflect reality. Scanning JSONL for the API response model field is the only reliable way to verify.
Cache TTL Status: Still 100% 5m
Updating the cache TTL situation. Scanning 4/30-5/7:
| Metric | Main Agent | Sub Agent |
|---|---|---|
| Total API calls | 37,366 | 26,160 |
| 1h cache write | 100% | 0 |
| 5m cache write | 0 | 100% |
Since the first post’s 4/9 mark, sub-agents have been at 100% 5m for 29 consecutive days, zero 1h writes. No sign of reverting.
How to Scan Your Own Data
Building on the Python from previous posts, now with model breakdown:
| |
Run it to see what model your main agent actually used — and whether it matches what you selected.
Conclusions
- Model choice is the biggest cost factor. Cache TTL affects cost ~2x; model affects 5-11x. The cache read price gap between Opus and Sonnet (5x) translates to thousands of dollars per day
- The server silently switches models. I selected opus-4-6, but across 36 days, 17 were switched to sonnet-4-6 or opus-4-7. Same pattern as the cache TTL regression — no announcement
- Sub-agents using Opus is the biggest waste. Sub-agent work is search and exploration; Haiku is sufficient. Sub overhead with 76% Opus is 80x higher than with 92% Haiku
- High S/M ratio isn’t inherently bad. What model the sub uses matters more than how many times it runs. Many cheap sub calls beat one expensive Opus sub call
- The most efficient combination ($167/M main output) and the least efficient ($1,925/M) differ by 11.5x — same user, same project, same type of work
What model you select in Claude Code doesn’t matter — what matters is what the server actually gives you. Scanning your own JSONL is the only reliable method.